This week I found myself needing to make a map that depicted the current range of Propithecus verreauxi lemur populations throughout southwestern Madagascar. You know, as one does.
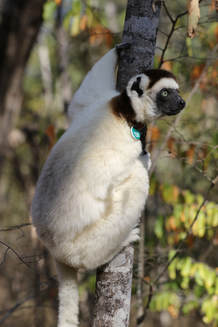 Photo credit: George (PJ) Perry | Lucky for me, the folks over at the International Union for Conservation of Nature (IUCN) maintains a Red List of Threatened Species, which evaluates the conservation status of species all around the world. You can search a species, and the IUCN database will explain how the species is classified into one of the following categories: Not Evaluated, Data Deficient, Least Concern, Near Threatened, Vulnerable, Endangered, Critically Endangered, Extinct in the Wild, or Extinct. The assessment information is listed in a table of publications from which they have acquired data, including the current species range (click “View Map”). |
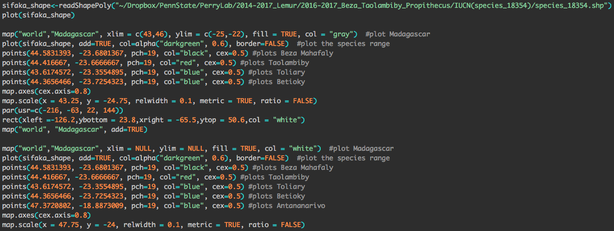
| I downloaded the Spatial Data for P. verreauxi (see bottom left), and had to figure out how to add this “shape” data to a map of Madagascar. After trying out a bunch of different packages, I ended up going with a basic maps format (still working on getting a nice looking ggmap). I’ve managed do two things so far: plot the species range to 1) a full country map of Madagascar [bottom middle] and 2) to a “zoomed in” inset of Madagascar that highlights how close the red and black sites are to each other [bottom right]. | 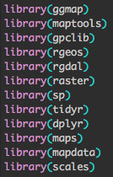 |
Ideally the large map of Madagascar will be inside that white inset on the “zoomed in” map, but I’ve yet to make the add = True argument actually do what it’s supposed to. Scroll all the way down to see the code I used. Anyone have some helpful hints?
Also, if it makes you sad that these gorgeous sifakas are on the endangered species list and you would like to help a conservation effort in some way, I would like to recommend beginning your lemur aid efforts by checking out LemurLove. They are some good people just trying spread the love for lemurs :) Cheers!
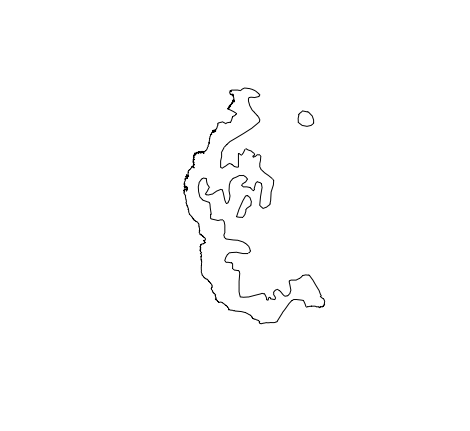 Verreaux's sifaka shape data from the IUCN database. | 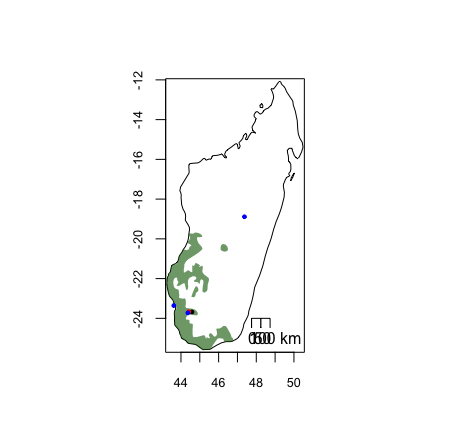 Sifaka shape data (green) plotted onto a full map of Madagascar. I'll make the scale bar prettier later. | 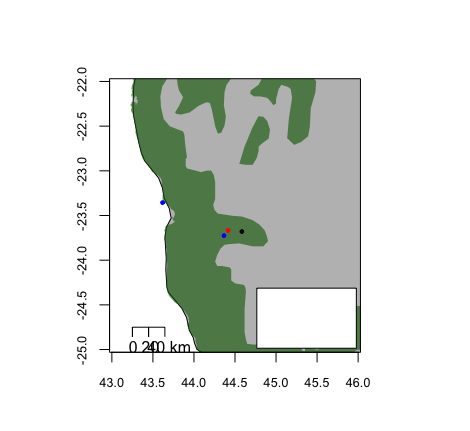 "Zoomed in" view of important field sites in black and red, and larger cities in blue. |
Good gosh, please don't judge me for my crazy directories. My Dropbox might be a little over-organized...
 RSS Feed